

For most physical therapy private practices, and in fact, most healthcare businesses in general, new evaluations are the practice’s lifeblood. Indeed, you’ve probably heard the saying, “There are only three ways to increase revenue – more new patients, more visits per patient, and getting paid more each visit.”
Marketers know this and pledge to contribute to a practice’s growth, often using statistics or impressive numbers to substantiate their claims. As the saying goes, “Numbers don’t lie.” But what if some marketers are misusing numbers to paint a rosier picture than reality presents?
Let’s use an imaginary physical therapy digital marketing agency, Acme Marketing, as a case study to understand how marketing outcomes can be skewed to encourage trusting PT business owners to pay for services that don’t generate the promised returns.
Understanding Correlation vs. Causation
Acme Marketing enjoys attributing any business success to its services, irrespective of whether it contributed to that success.
They state: “Within six months of implementing our marketing program, ABC PT doubled their new patient acquisitions.”
This statement might have you believe Acme Marketing is exceptional. But what if ABC PT expanded into a new location that attracted high foot traffic and lacked competition?
The assertion of causation based on correlation (X resulted in Y) should invite skepticism and a deeper inquiry into other potential contributing factors.
A correlation can signal four scenarios:
- X caused Y
- Y caused X
- A completely unrelated factor, Z, led to X or Y (like opening a new clinic, in our example)
- No causal relationship exists
Deciphering Data Visualizations: A Double-Edged Sword
Data visualizations aim to simplify complex data. However, they can distort information just as efficiently. Let’s explore a couple of ways this could happen.
The Truncated Y-Axis
One common manipulation method is truncating the Y-axis in a graph or chart. The brain expects the Y axis to start at 0 and end at the highest number. Let’s see what happens when this expectation is violated. Suppose your practice spends $500/month on marketing, and
Acme Marketing proposes a program that costs $2000/month plus the existing ad expenditure.

At first glance, the growth seems remarkable. But note the truncated Y axis, starting at 4.70%, which amplifies minuscule increases to appear more significant. Also, note the tiny range (increasing in 0.10% intervals) on the Y-axis.
Let’s Look at the Data with a Change to the Y-Axis and 1% Point Intervals
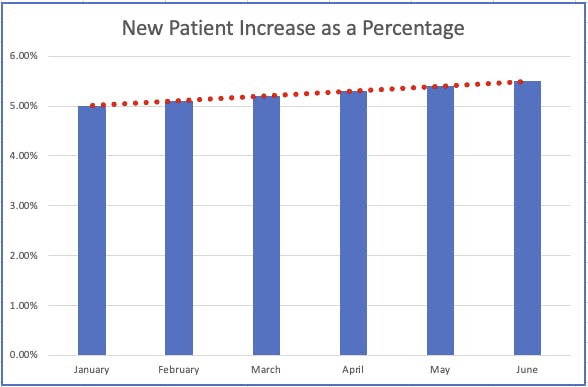
How likely will you now spend an extra $2000/month on this program? The answer is that it depends on the true number of new patients represented by a 0.10% percent in patient volume each month. Is 0.10% growth equal to 3 additional new patients per month or 30?
The Case of Missing Data
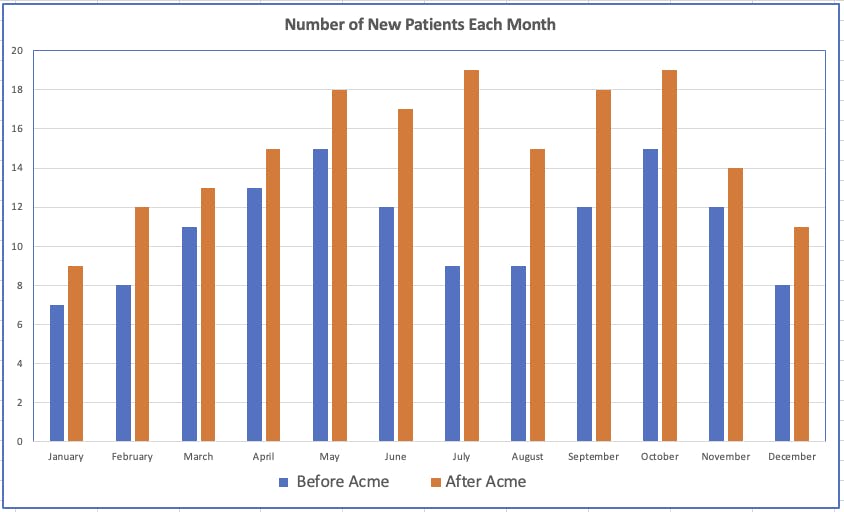
Marketers might manipulate data by omitting unfavorable details. Acme Marketing, for instance, might exclude information that contradicts the narrative they want to promote.
The chart initially presents Acme as a no-brainer solution until you discover what they didn’t include: the cost of the new program and its implementation.
To get a fair comparison, we need to consider these numbers:
- Current marketing cost = $400/mo. or $4,800 per year.
- Acme plan costs $1500/mo + ad spend of $1500/mo = $3000/mo.
- Acme plan also requires a $5000 investment over the first three months to build out the sales funnel.
- The annual cost per new patient before Acme plan = $4800/131 new patients = $36.64/per new patient
- Annual cost per new patient after Acme plan = $41,000/180 new patients = $227.78/per new patient
Once you factor in these costs, the new patient acquisition costs with Acme turn out to be 522% more than the marketing investment before the implementation of Acme’s marketing program.
At that cost of acquisition (i.e. $227.78/new patient), it eats up all of your profit from each new patient acquired, and it’s highly likely that this marketing program is operating at a loss.
The decision now seems clear.
Acme Marketing Company Promotes Outlier Case Studies

Here’s a typical example: If 99% of companies saw less than 15% growth in new patients with Acme’s plan, but one company experienced a doubling of new patients, the latter would become the case study, skewing the perception of potential success.
Case studies should represent a typical scenario, but a common practice by some deceptive marketers is to select outliers that skew results positively.
Note, that Polly PT has only been in business for 6 months. How many new patients was she seeing each month for the first six months? Context matters.
Unraveling the ‘Average’ Mystery
From school, we know the term “average” might be misinterpreted to represent the mean, median, or mode. But when marketing data only includes the mean, the overall picture can be distorted.
Let’s review how to calculate the average, median, and mode
The Average is the arithmetic mean and is calculated by adding a group of numbers and then dividing by the count of those numbers.
The Median – Arrange the data points from smallest to largest. If the number of data points is odd, the median is the middle data point in the list. If the number of data points is even, the median is the average of the two middle data points in the list.
The Mode is simply the number that occurs most often in the series.
Take a look at this chart:
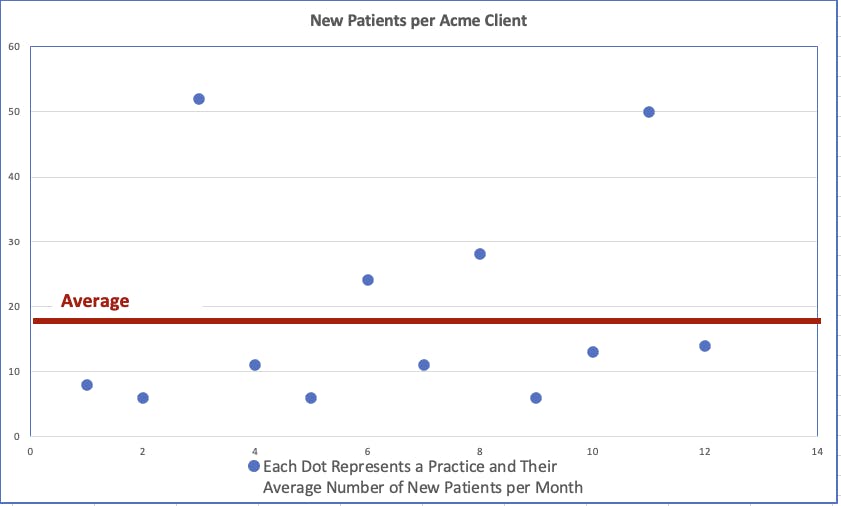
Average = 19
Median = 11
Mode = 6
If the breakeven point of Acme Marketing’s strategy for your practice is 12 new patients per month, and you are told the average number of new patients per month from Acme’s marketing strategy with other practices is typically 19, you could make a very costly decision…one that could put the practice in a financially difficult position.
In other words, if you only looked at the red line or the average, you might think that you’re likely to get about 19 new patients per month. Knowing the median and mode demonstrates that the most common number of new patients is 11, and 8 out of 12 practices got less than the average number of new patients per month.
The Allure of Cumulative Numbers
Big numbers are compelling. But without context, they can be misleading. When a company like Acme touts a large cumulative number without a date range or averaged results, tread carefully.
Marketing Numbers are Important, but View Them with Healthy Scepticism
This article isn’t meant to deter you from investing in sales and/or marketing. On the contrary, without investing in a marketing system, PT practice owners will struggle. Nevertheless, you must equip yourself with the skills to interpret the data you receive and make informed decisions about your marketing investments.
Here are Some Final Thoughts
- Researching before signing a contract
(BTW, E-rehab doesn’t have any contracts), - Consider the company’s reputation
(E-rehab has a 98 Happiness Score, over 360 Google reviews, and 20+ years of experience) - Don’t be embarrassed to ask the hard questions,
(We love questions, transparency, and setting real expectations) - Seek feedback from others.
(We are happy to provide references)
These steps can reveal potential blind spots and expose hidden data that could guide you in making more intelligent decisions.